My wife and I have this argument, that is as ancient as time itself -
WHO DRIVES BETTER?
(The answer is, obviously me, right?)
I bet y'all know that feeling, when sitting in the passenger seat, filling nausea and is difficult to rest, let alone sleep. Well I know these feelings too, every time she drives there's must be at least 1 emergency brake. To make this clear, my wife is an excellent driver. But thanks to that argument between us. The next project was born. And I'd like to get this matter settled once and for all. But how?
TL;DR
Its driving grader kit, it grades how you drive.
For projects code
There are many possible solutions for this one (for example - installing an Mobil Eye kit, and count its squeaking sounds per driver, then compare squeaks). Well, to get this done properly, first, I need to define the problem. So after some brain storming, I realized I want to solve 2 problems:
- Score the drivers driving. (this post)
- Detect who drives. (in the bucket list)
To solve this, I first needed to answer another question - What is a good driving?
Well, I claim that drivers driving is measured by how comfortable the passengers feel. And physically talking - how big are the accelerations change in various directions (or axes). Thus, to measure a driver driving, I actually need to measure accelerations change inside a moving car.
Well, lucky me I work in a Huge MAKERS-SPACE, so figuring this out was quite easy, because all the needed equipment is within reach. Hence for this project I used:
- Raspberry pi 3B+ (With RPI LCD)
- IMU sensor (what is IMU?)
- 1kΩ resistor X 2 (for pullup resistor).
- Some jumper wires.
1. Project Setup
Download rasbien.
1.1 Create bootable microsotable microSD using Etcher.
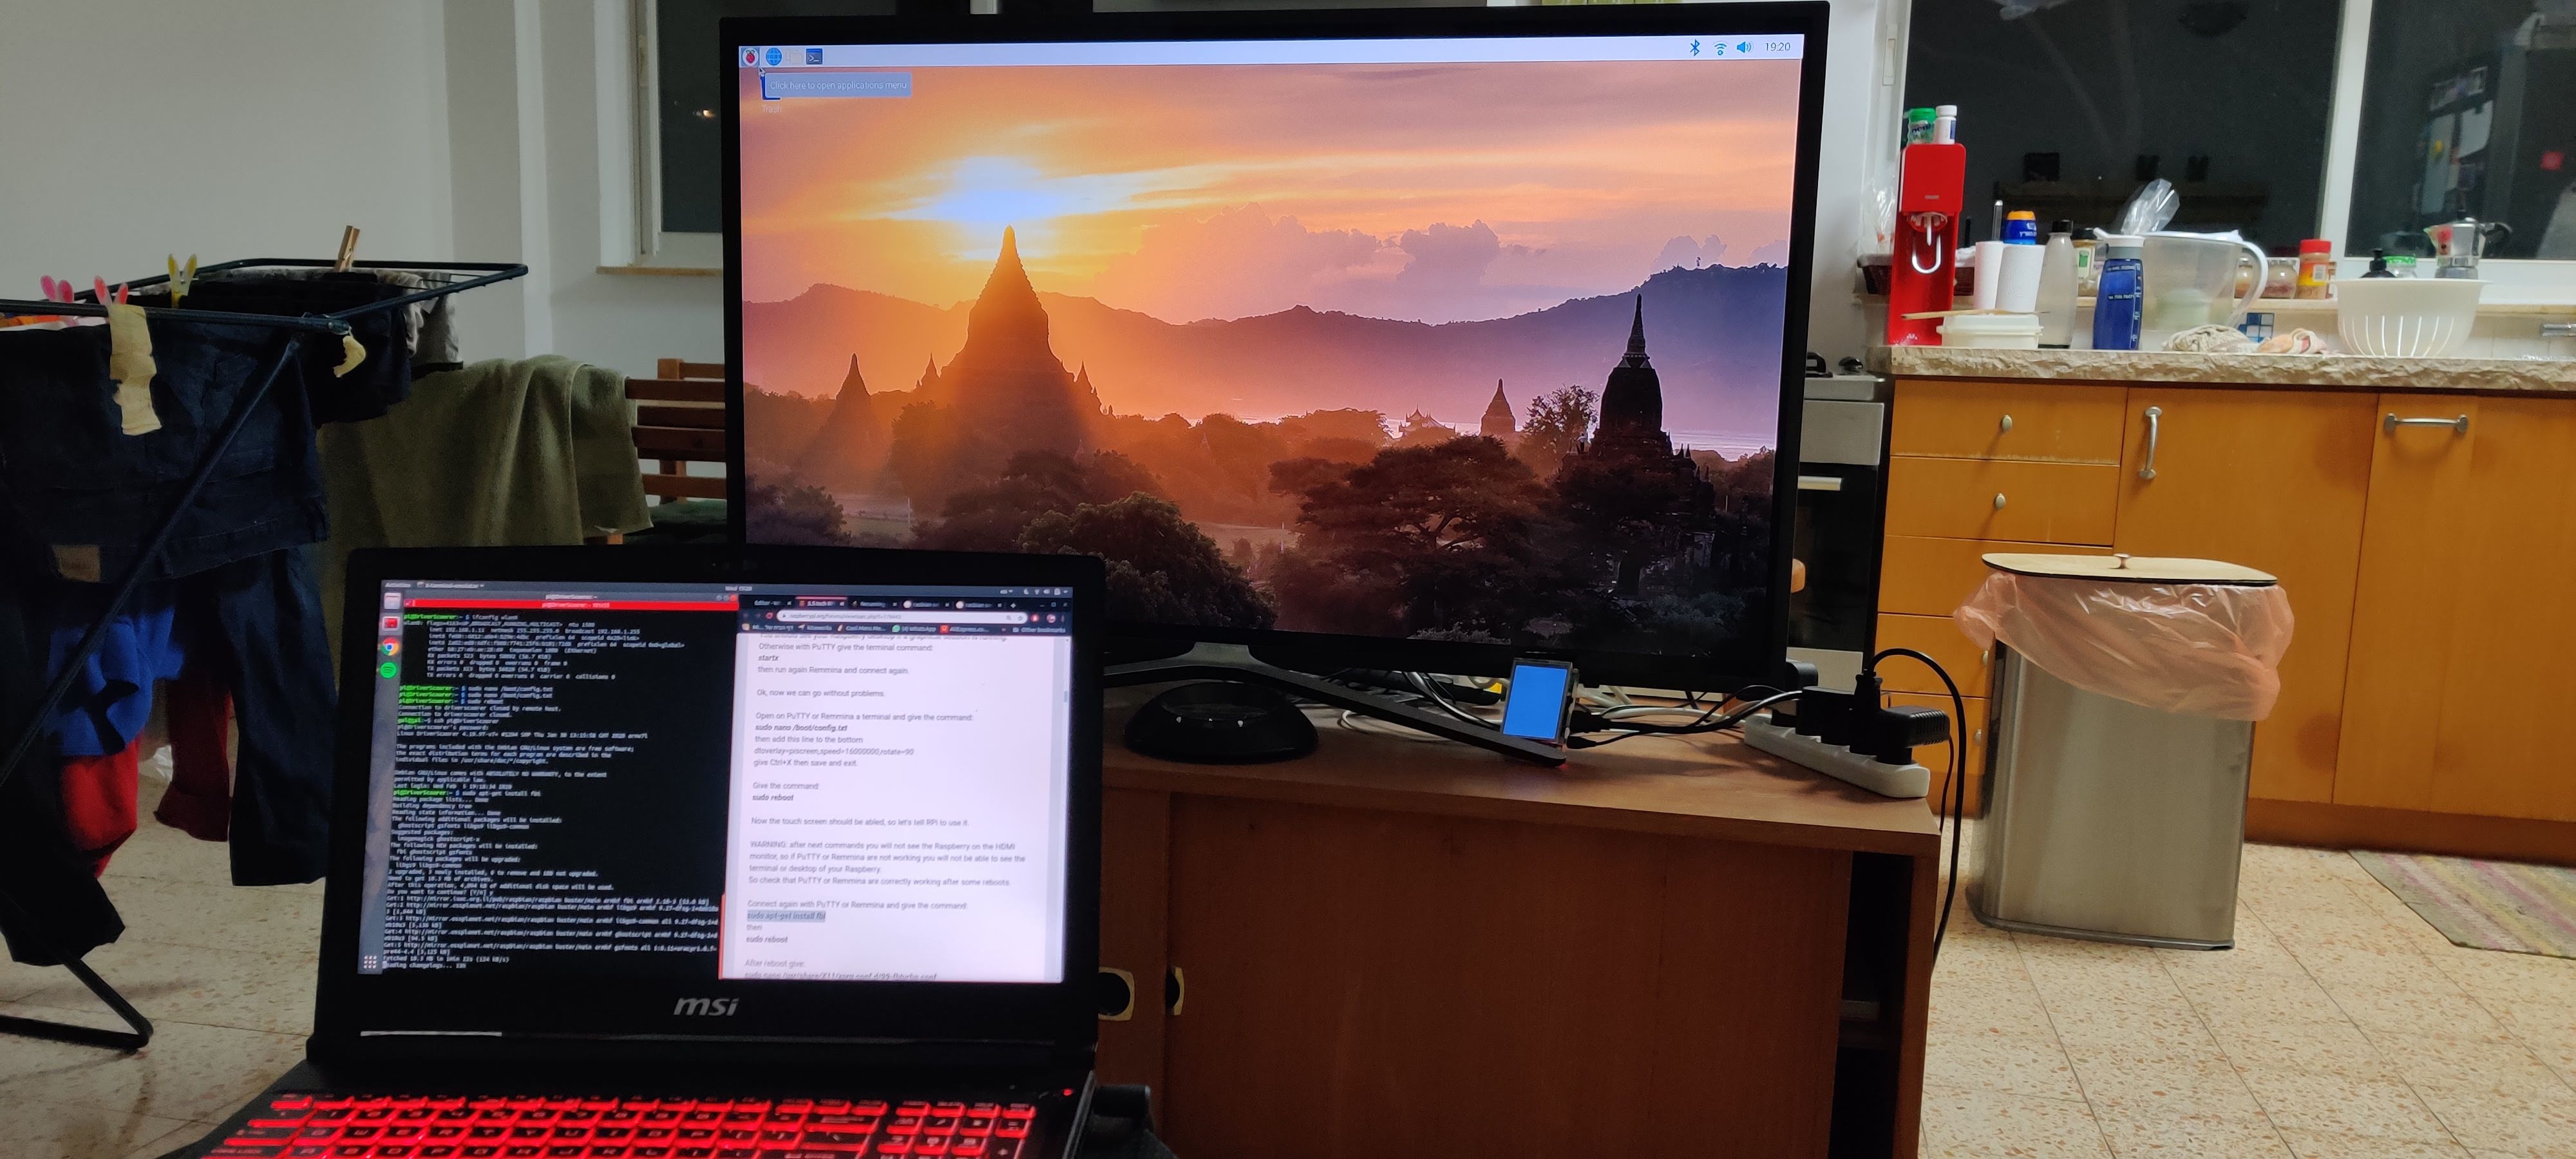
1.2 Get the LDC screen working, (I also rotated the screed using the instruction here)
1.3 For convenience - change RPI hostnameSetting IDE
At first the intention was to set Pycharm on my laptop to work with a remote Python interpreter from the RPI, but it seems that this option is not available for Pycharm-community. So eventually installed VNC, and used a graphical SSH, after accessing the RPI via graphical SSH, Pycharm was installed on the RPI.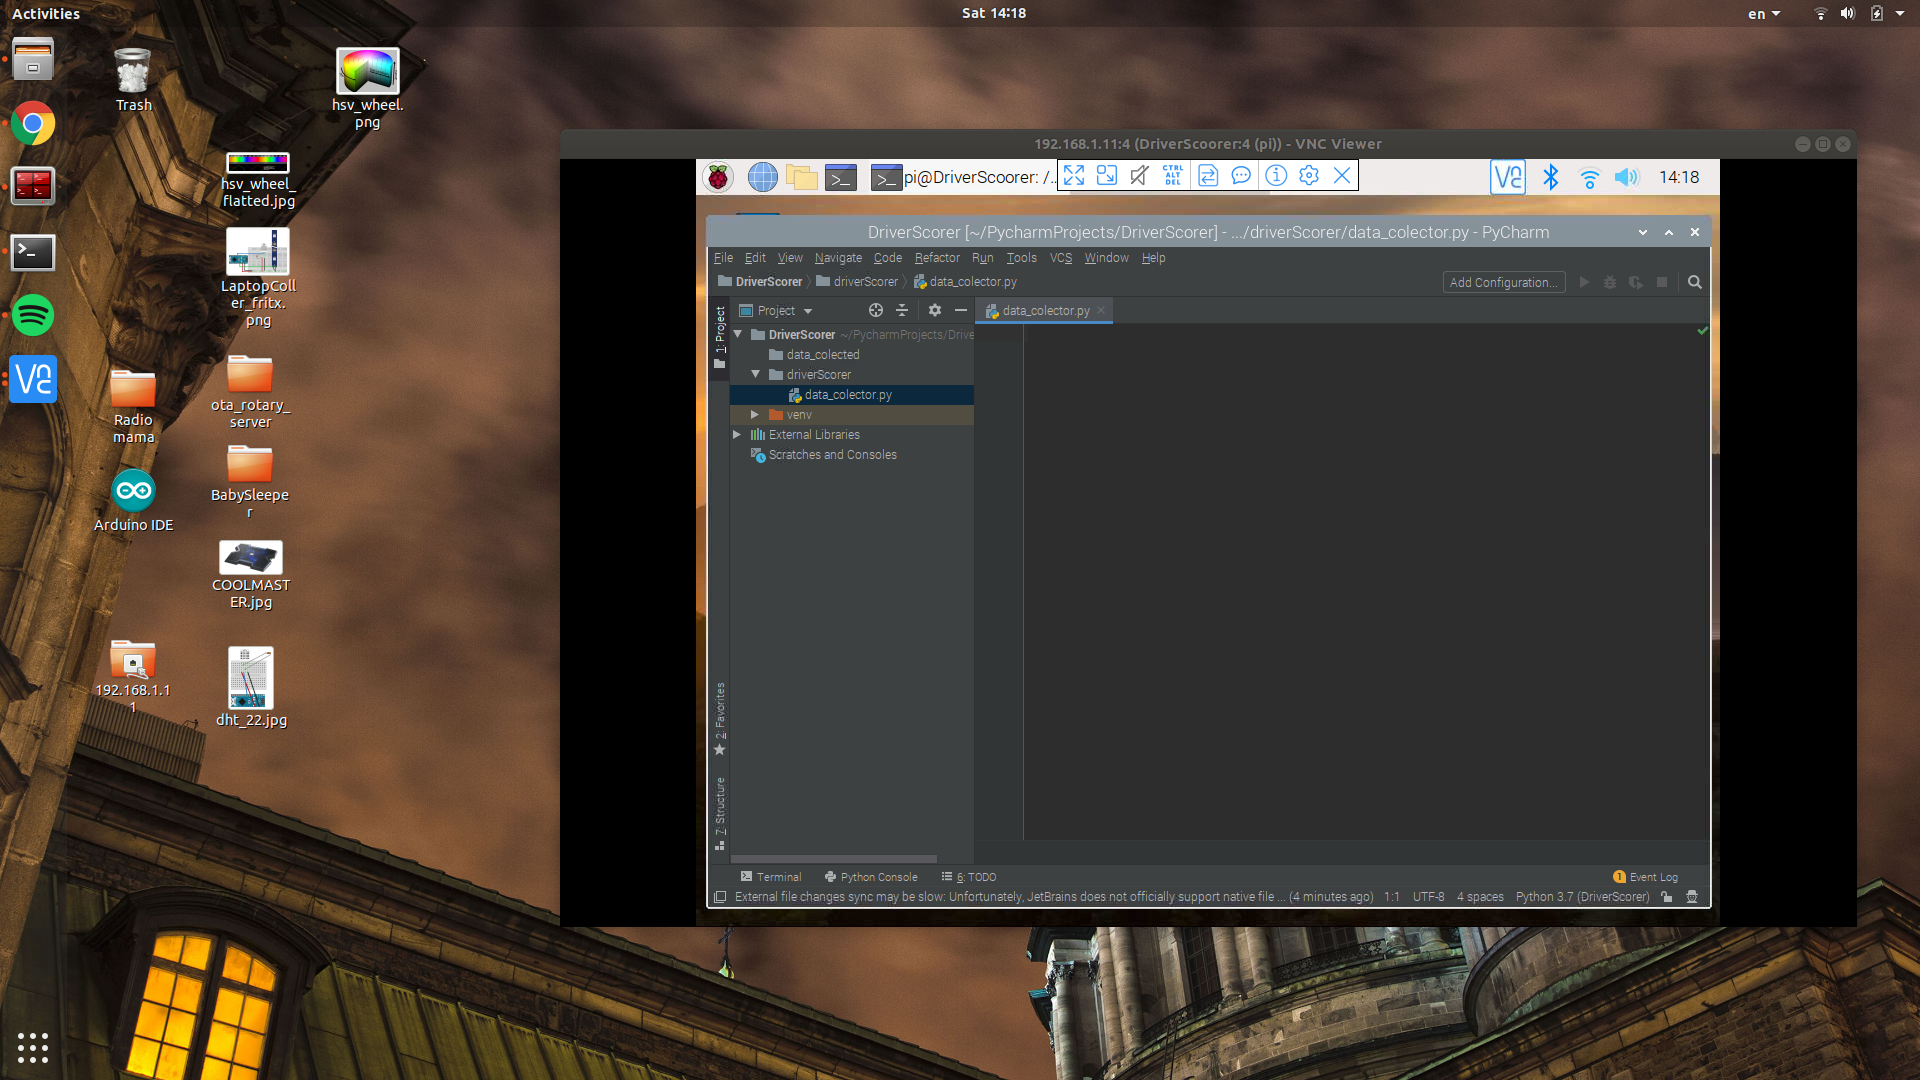
Now it is possible to work on Pycharm, that is intalled on the RPI, But view the window through graphical SSH on the laptop. This is the most convenient way to develop the GUI, and working with the IMU sensor, because it all happens on the RPI. Later on, after gathering all driving data, EDA will happen on the laptop.
In order to work on the project in these configurations:
First: Connect the RPI via ssh, and bring-up the VNCserver:
vncserver
Second: In laptop open the VNCclient app, and connect to the RPI IP. (assuming they both connected to the same network).
2. Working on the GUI
I need to implement some minimal GUI, So the driver could interact with the DriverScorer kit.
Getting acquainted with DASH
My first option for a possible GUI.
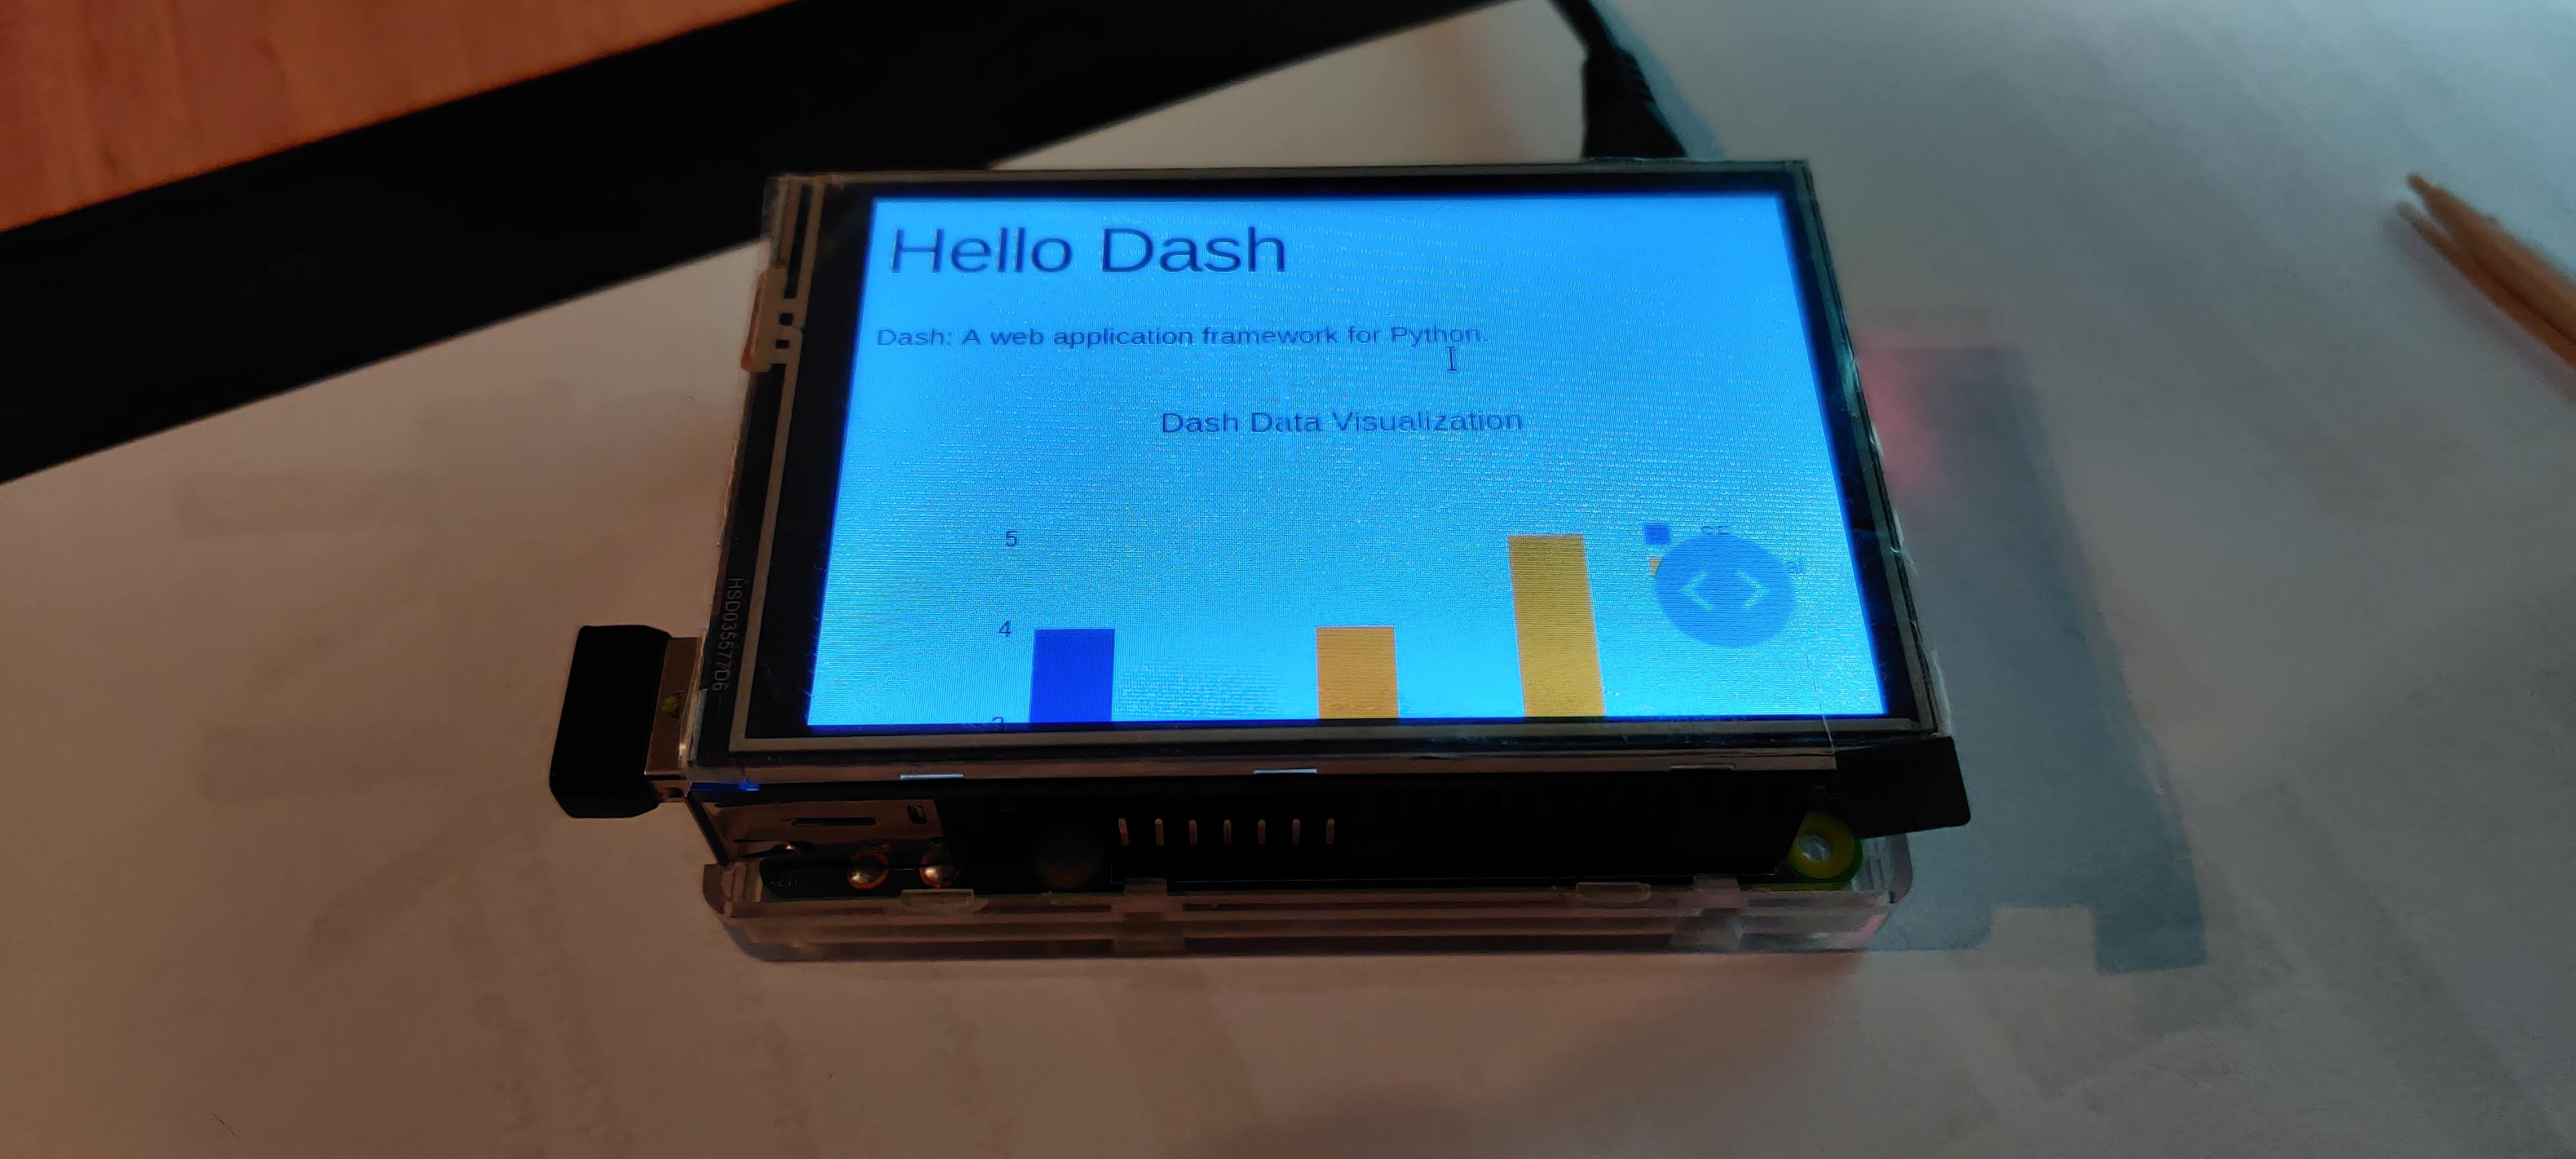
Before diving into messing with IMU sensors, first I needed to make sure the RPI LCD is capable of working with DASH:
- DASH installed, in the venv on the RPI.
- DASH is new to me, so I Ran through some of their tutorials. While doing so, I've found another problem:
My RPI LCD is 3.5", so when running tutorial's python script, the browser buttons take the most of the screen:

Which make it difficult to use the DASH app, So I enforced the browser to become full screen right after it opens:
To do so, I used Xdotool, and via python script:
import subprocess

do-some-stuff-in-DASH...

subprocess.call(["xdotool", "F11",])  # Make it full screen
While this hack worked, I encountered a more annoying issue - DASH is slow on the RPI, like REAL slow!
It took DASH 1 minute and 40 seconds to boot up (not to mention it boot's into the annoying not full screen mode). There got to be another way out there to present some nice UI, Luckily, I know another way.
Using PySimpleGUI
Last month (1.2020) I've submitted My Final project of the B.Sc degree, It is about proofing, and implementation of boolean operation on automaton. Long story short - I worked with PysimpleGUI, and it was awesome!
Another thing worth mention - PysimpleGUI is blazingly fast!
It took 1.4 seconds to bring up this GUI, which is 7142.8% faster than DASH.
So within few lines of code, I got this:
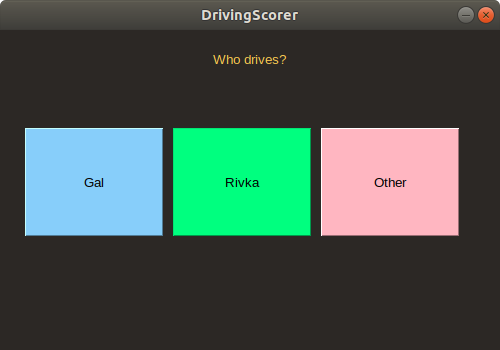
This GUI is for data gathering & labeling, and naive driving scoring, after the driver chooses who drives, the data is being saved with timestamps and labels into a CSV file, and there's some nice graphing for driver feedback:
Perfect, right?
Note: Until here, I've developed the modules using sensor mocks because all this work was done on my laptop, and there's no GPIO there. Now, since I have a nice GUI for data gathering, all left is to actually get the data.
3. Setting up the IMU sensor
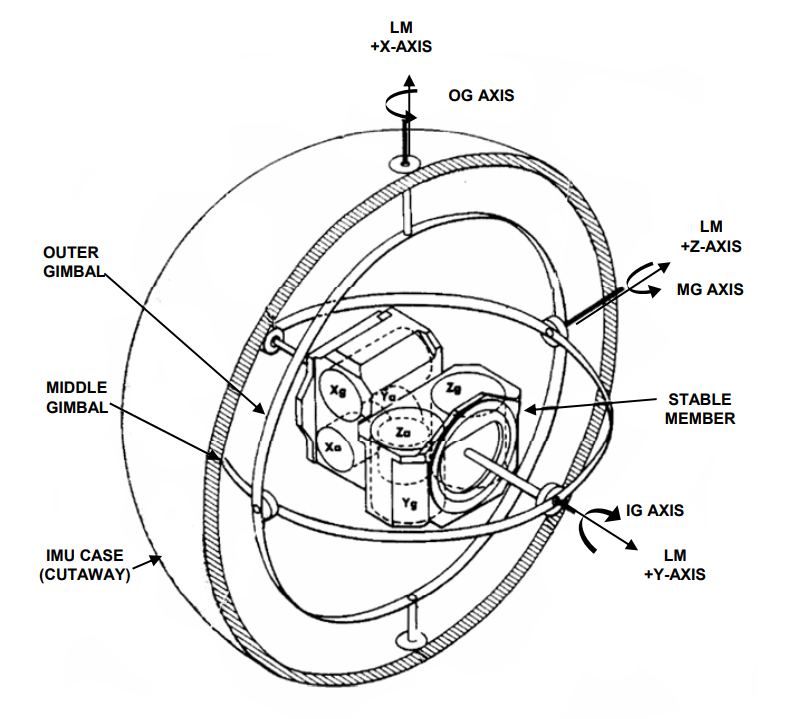
By now, we should know what is an IMU sensor.
The IMU I have is GY-91, which is a 10-DOF (degrees -of -freedom), which means that it measures:
- Three-axis gyroscope.
- Triaxial accelerometer.
- Triaxial magnetic field.
- Pressure.
According to This site.
An IMU provides 2 to 6 DOF (Degrees of Freedom), which refers to the number of different ways that an object is able to move throughout 3D space. The maximum possible is 6 DOF, which would include 3 degrees of translation (flat) movement across a straight plane/along each axis (front/back, right/left, up/down) and 3 degrees of rotational movement across the x, y and z axes/about each axis.
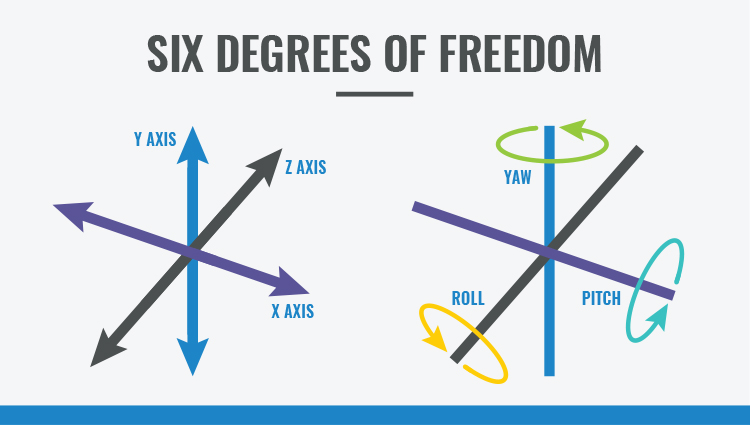
So this so called 10-DOF is composed of a 3-axis accelerometer and a 3-axis gyroscope, which would be considered a 6-axis IMU. And it also include an additional 3-axis magnetometer, which would be considered a 9-axis IMU. The last "Degree of Freedom" is the pressure.
But-But-But, Why measure pressure?
Well as we've seen, IMU's are used to measure acceleration, angular velocity and magnetic fields, and, when combined with sensor fusion software, they can be used to determine motion, orientation and heading. So my guess is, a pressure sensor can determine object's height.
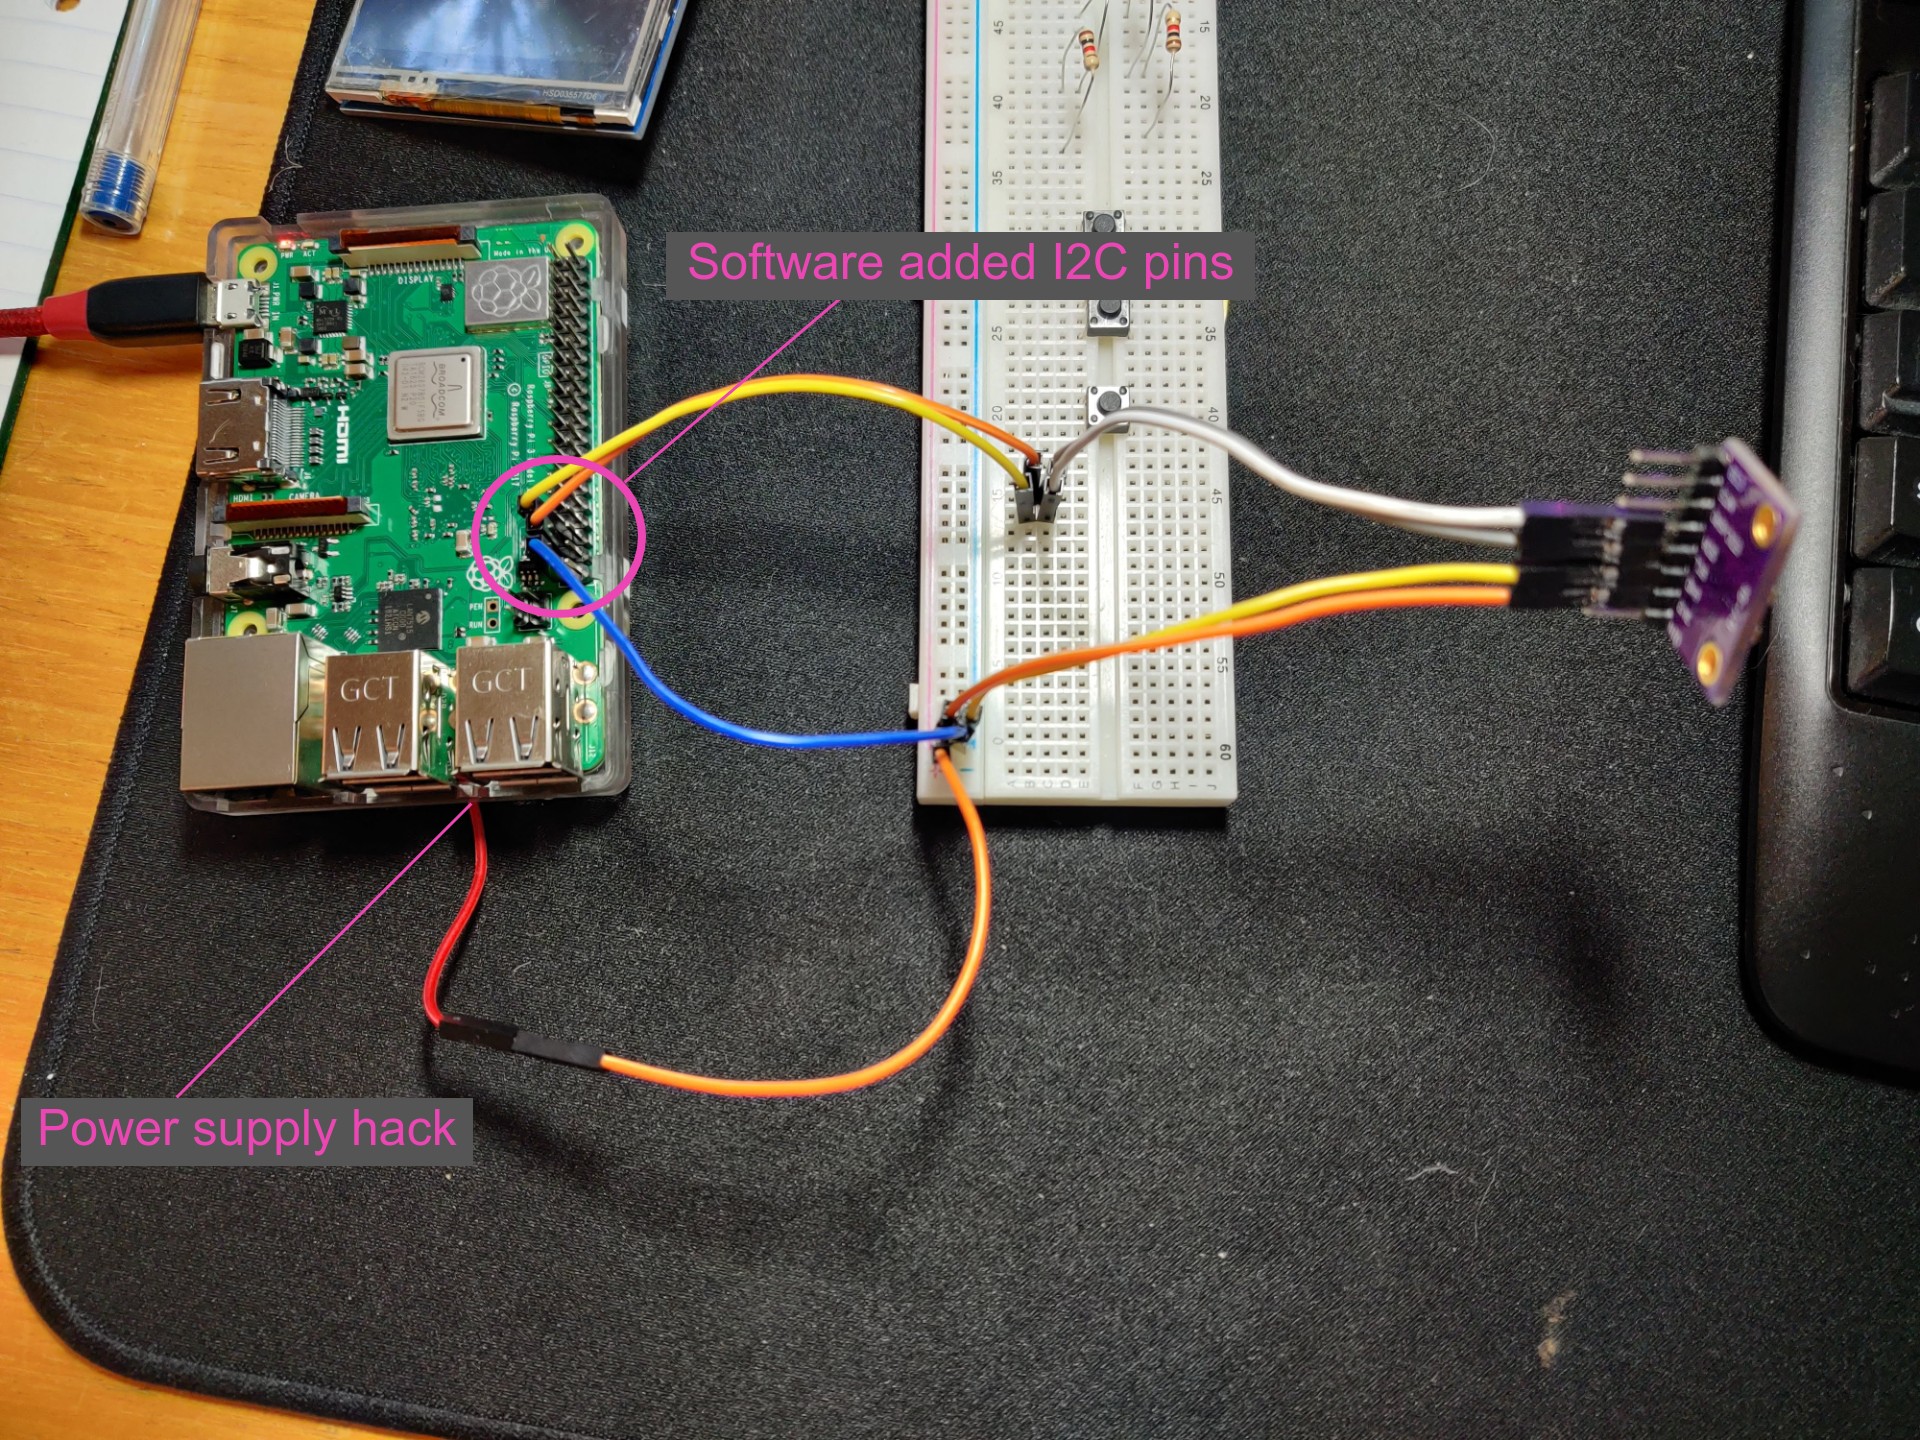
This IMU (MPU-9250), use 3-5v, and its communicate through standard I2C communications protocol that uses pins SCL[pin 5] & SDA[ pin 3], which makes things a bit challenging because the LCD screen already uses the RPI I2C pins:
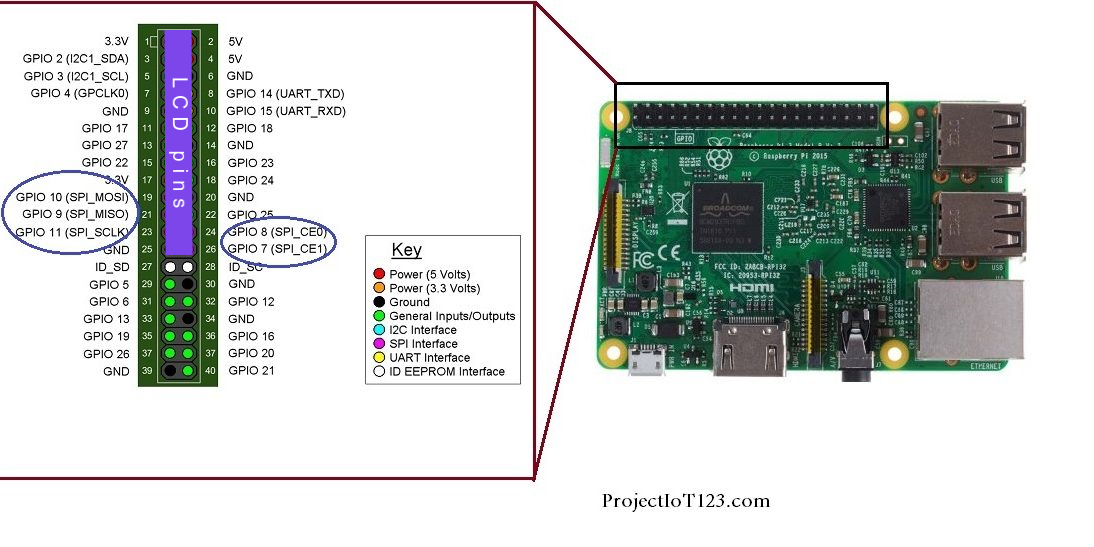 (In purple, LCD pins usage, they use all I2C's)
But as Asimov once have said:
"I'll take that challenge. It's a dead hand against a living will"
At first, I made the sensor work with original SDA/SCL pins (the LCD removed) using this tutorial.
The tutorials pipeline went like that:
Enable the I2C on the RPI:
I typed in terminal -sudo raspi-config, then under Interfacing-Options, I enabled I2C.sudo apt-get install i2c-tools.Check if the RPI recognize the sensor:
i2cdetect -y 1.
(1 is the I2C bus on the GPIO)I've got this:
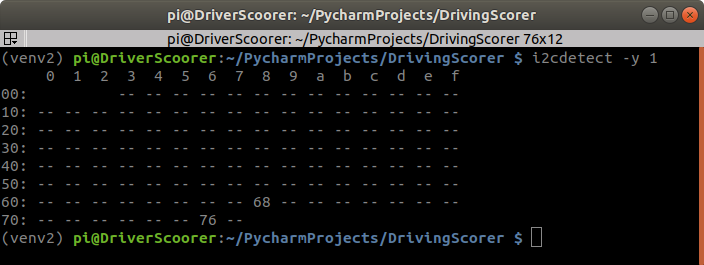
There's 2 devices detected (2 addresses):
68 is the MPU9250 sensor.
76 is the pressure sensor.
Changing the sampling speed of the I2C bus, In terminal
sudo nano /boot/config.txt(Iv'e added the line where the markers at).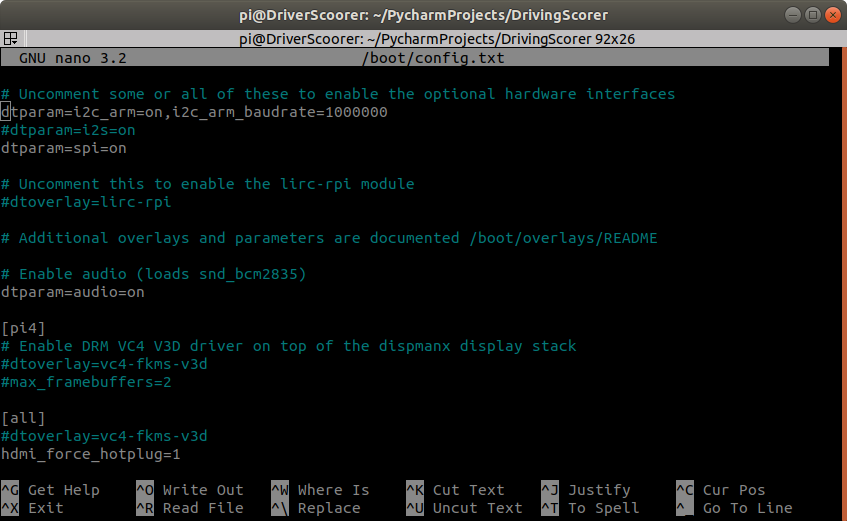
The next thing, ran the python test script, from their tutorial, and receive the sensor printout:
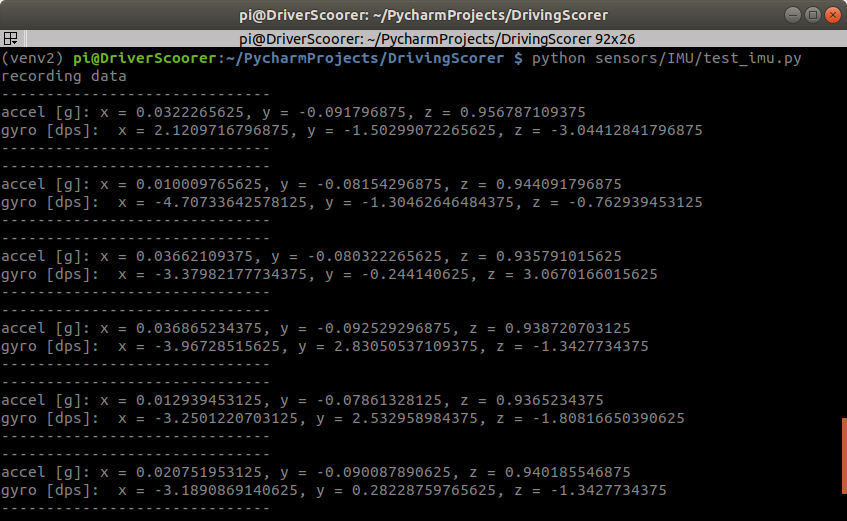
The printout above can be used to verify that the sensor and code are working correctly. The following should be noted:
In the z-direction we have a value near 1, this means that gravity is acting in the vertical direction and positive is downward
The gyro is reading values close to 0, and in this case we haven’t moved the device so they should be close to 0
With these values verified, we can state that the MPU9250 sensors are working and we can begin our investigations and some simple calculations!
One last thing, in order to use the LCD & the IMU, I've made 2 changes to the RPI:
Because the LCD takes all the 3.3v and the 5v power pins, I've needed to extract 3.3 power supply to the IMU:
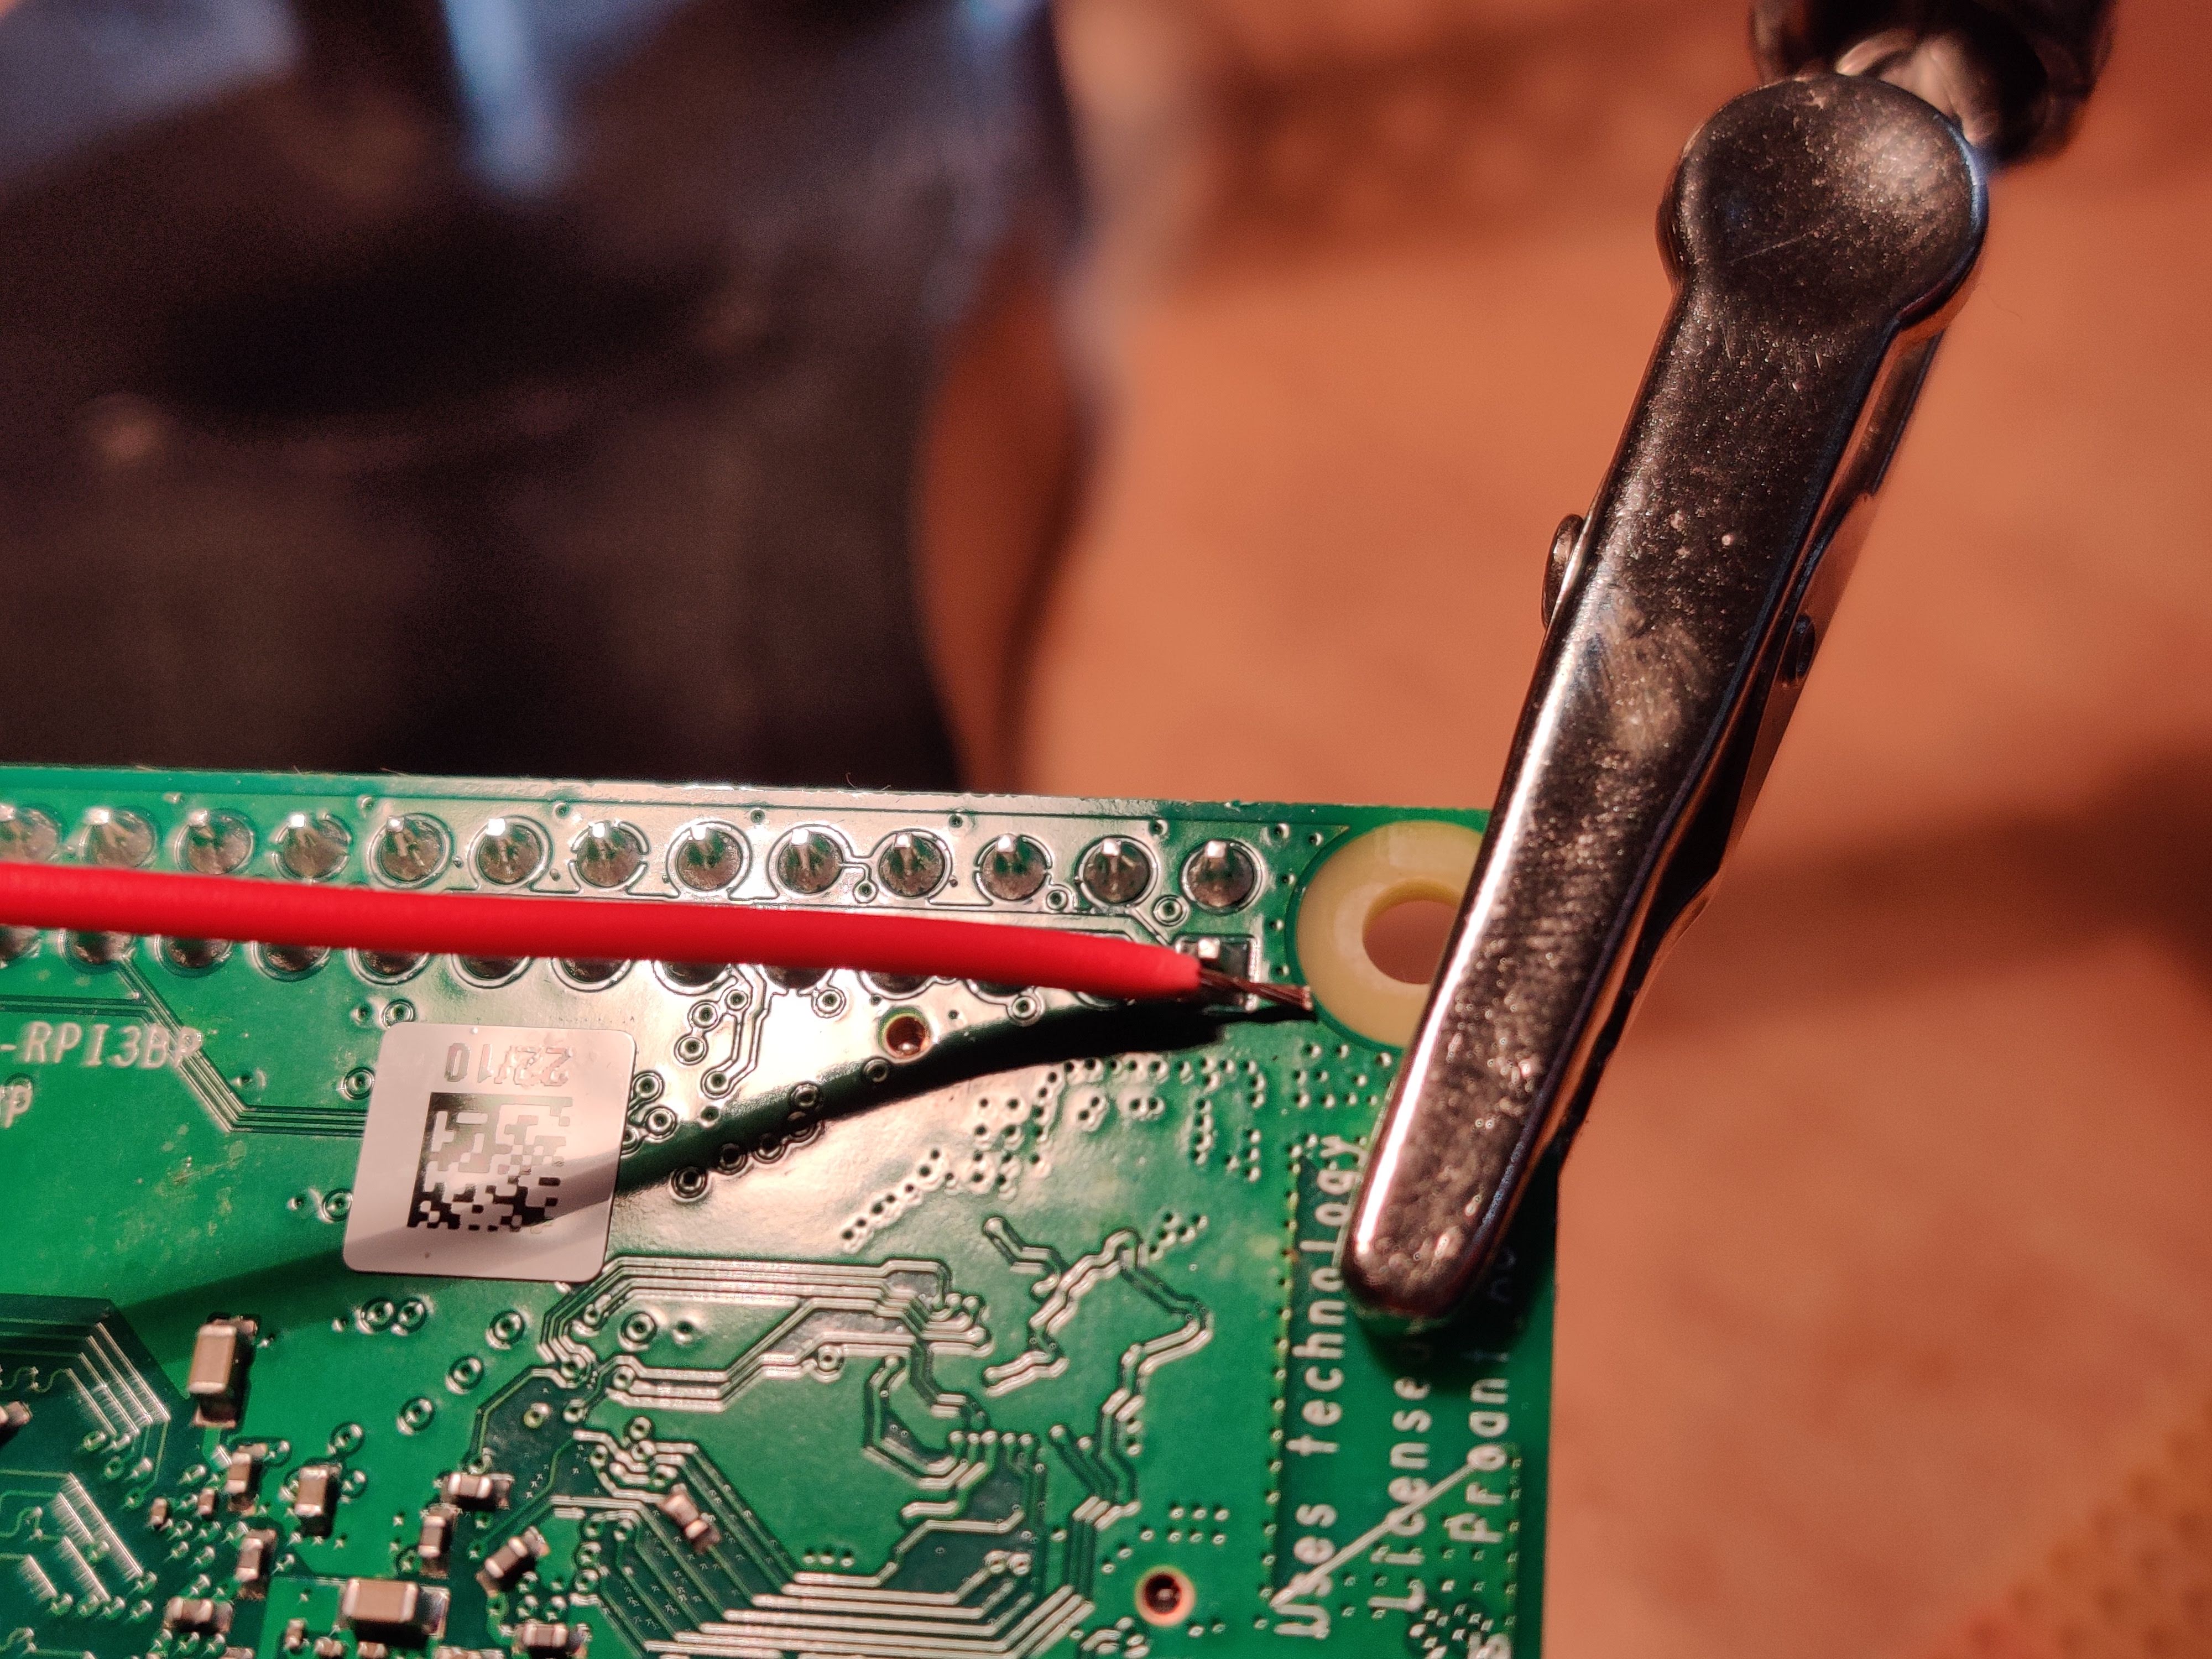 I've soldered from the back side of the RPI board, where the 3.3v power supply pin, another wire.
Because the LCD takes all the I2C pins, I've needed to configure new I2C pins, using software I2C, using this explanation, I've added to
/boot/config.txtthese line:
AVAILABLE_GPIO_1 = 19
AVAILABLE_GPIO_2 = 26
dtoverlay=i2c-gpio,i2c_gpio_sda=AVAILABLE_GPIO_1,i2c_gpio_scl=AVAILABLE_GPIO_2
Then after reboot, a new bus /dev/i2c-3 will be created. And is available with the standard I2C calls to use the bus.
And it worked like a charm!
After this tiny hack, I could put back the LCD screen.
4. Scoring the drive
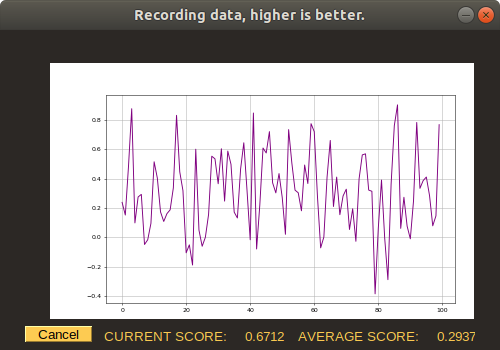
After consulting with my friend (and fellow maker, and author in this blog), Amir Avni, who cook algorithms for living. I've realized that the MPU-9250 sensor i've got is quite noisy, and in order to grade a driver according to the measures from this sensor, first I need to understand how the sensor behave, thus I made a some records of the sensor movement:
In the first recors, I moved the sensor slowly:
And this is how the raw data look like:
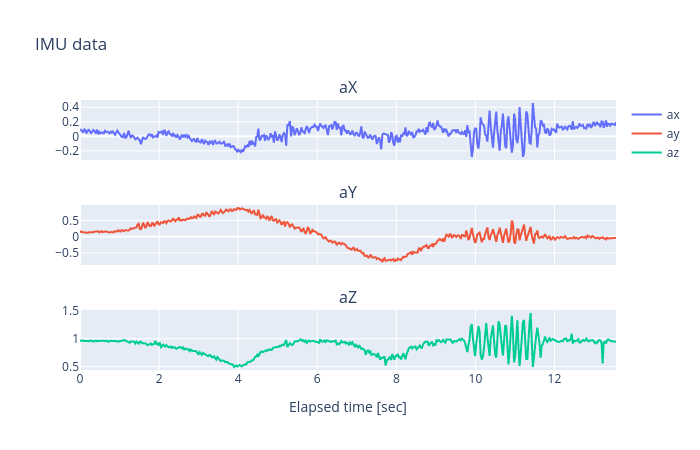
We can see that the data really is quite noisy.
I've made another test, but this time, the sensor is holding still:
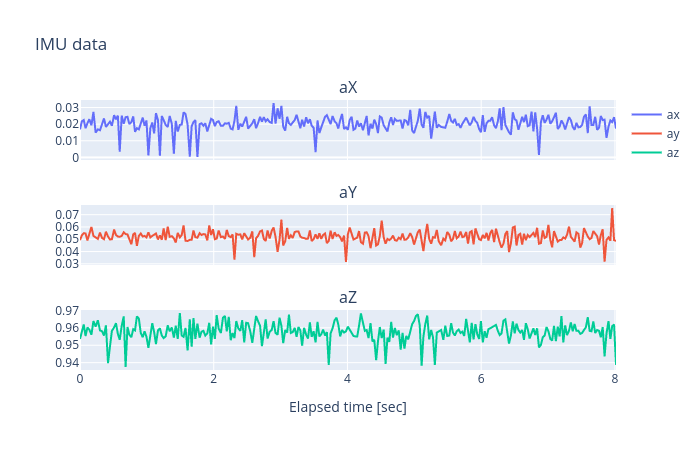
Note: Sharp-eyed will notice that the values at z ax, are vary around 1, it is because the earth gravity pulls us constantly toward the ground, at $1g$ which is the standard gravity $g_n$, but more importantly, we can see that the IMU sensor translate acceleration in Z ax to g, instead of raw acceleration units.
This tests confirms that the sensor is REALLY noisy. In order to outperform this noise, I need to measure its noisiness, BUT HOW?
5. Exploratory Data Analysis (EDA)
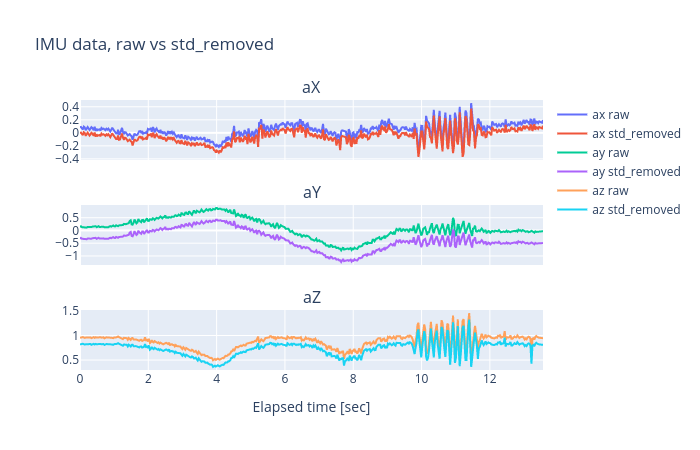
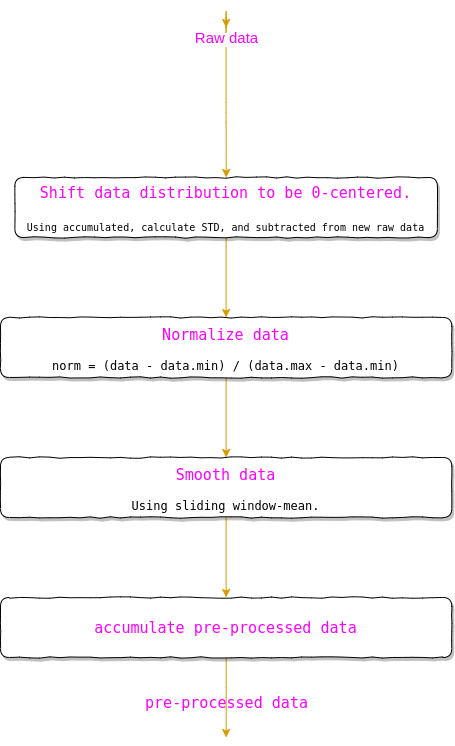
In order to measure noisiness and performing data-driven observation, first some post-processing are needed, here's what Iv'e done.
All examples will be according to our first measure:
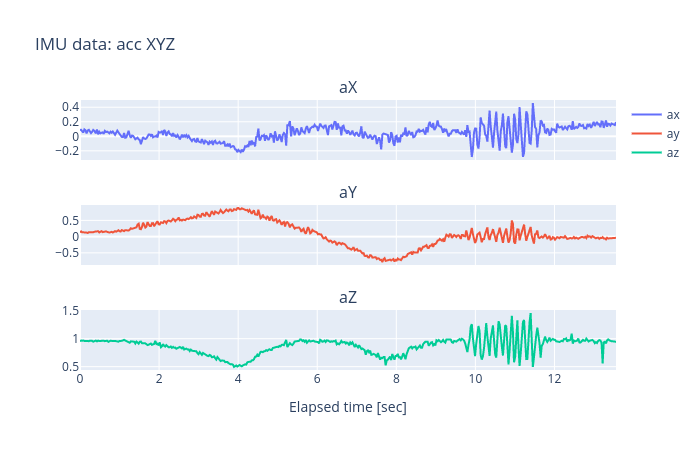
Step 1.
Measure standard deviation then subtracting it from the hole data, thus shifting data distribution around the 0, here's a nice explanation about STD.
Here's measured std, per axe:
- ax: 0.0864982
- ay: 0.455563
- az: 0.136015
Here's how I did it (quite easy actually):
def calculate_std(df: pd, sample_time=-1) -> pd.DataFrame:
    if sample_time > -1:  # Remove STD of a specific record time ( useful if having a sensor "warm-up" time)
        temp = df[df['elapsed'] <= sample_time]
        std = temp.std()
        return std
    return df.std()  # Remove STD from all sampled data.
Than I removed calculated STD from all the data:
def remove_std(df: pd.DataFrame, calculated_std) -> pd.DataFrame:
    std_removed = df.copy()
    std_removed = std_removed.iloc[:, :7] - calculated_std[:7]  # Remove std from sensor data only
    return std_removed
Step 2.
Using a sliding window technique, I've passed on the recorded data, and calculated the mean of the data inside the window, thus smoothing the data, making it less noisy.
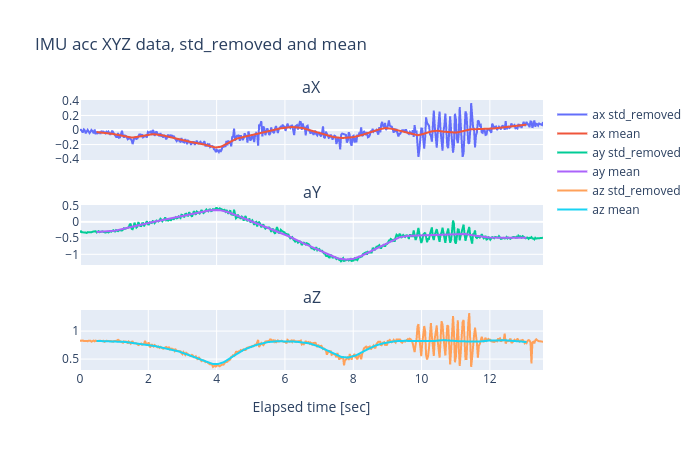
WOW, Major data loss!, In this figure, window_size is 1 [sec]. One can see that smoothing the data caused a major data loss, and this will cause the Driving-Grader to miss big acceleration changes (as can be seen in seconds 10 to 12), so maybe smoothing the data is not a good idea in this case.
A Better behavior, Here Is another smoothed example, with window_size is 0.2 [sec]:
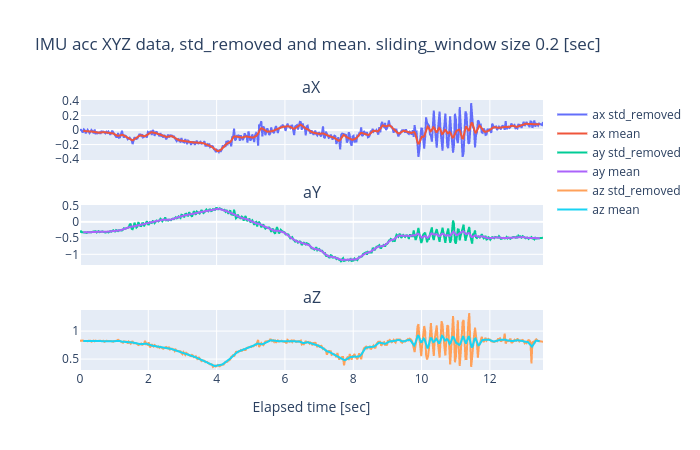
Here's how I did it:
def calc_mean_using_sliding_window(std_removed_input, window_size_sec_input: float = 1.0) -> pd.DataFrame:
    window_size = window_size_sec_input
    window_size_rows = calc_window_size(std_removed_input, window_size)
    mean = std_removed_input.rolling(window_size_rows, win_type='triang').mean()
    return mean
In order to use the sliding window technique:
def calc_window_size(std_removed: pd.DataFrame, window_size_sec: int) -> int:
    """

    :param std_removed:
    :param window_size_sec:
    :return: Number of rows that represent 'window_size_sec'
    """
    df = std_removed.copy()
    df['elapsed'] = df['elapsed'] - df['elapsed'].iloc[0]  # Fix timing
    return df[df['elapsed'] < window_size_sec].shape[0]
We have learned that window size is critical!
If grade is calculated accordingly to accelerations change, adjusting window_size when using sliding window technique, is critical. Here's why:
Grade is calculated according drivers driving, and as claimed before it being measured by how convenience are the passengers. But accelerations change may vary from different things:
If a driver enters into a path-hole, accelerations change will be aggressive, but the effect will disappear quickly, very like the data behavior between 10 to 12 sec of the records above. A window with 1 sec size will flatten this event, and wont consider this dramatic change wile grading the driver.
If a driver drive like Dom from Fast & furious, changing lanes quickly and aggressively, acceleration change will be much gentle, but will affect longer, so a 0.2 sec window will forget that there's an event, and wont grade accordingly.
Step 3.
One last thing I did before actually grading, Normalizing the data so all value will be between 0 to 1:
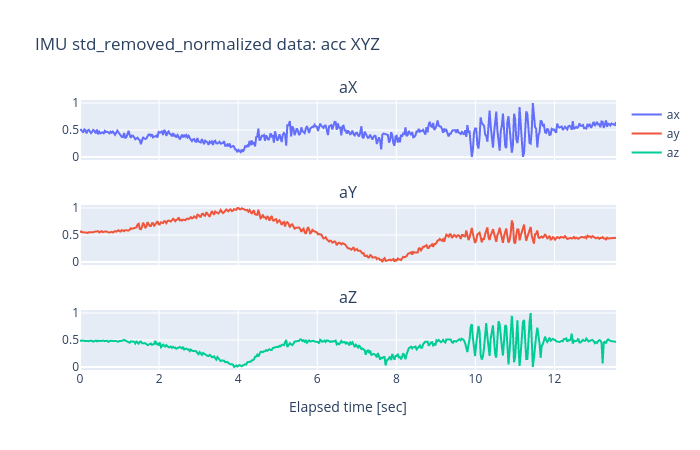
Here's how I did it:
def fig_normalize(un_normalized_data) -> pd.DataFrame:
    df= un_normalized_data.iloc[:, :6]
    df -= df.min()  # equivalent to df = df - df.min()
    df /= df.max()  # equivalent to df = df / df.max()
    df['elapsed'] = un_normalized_data['elapsed']  # Keep original data
    return df
EDA summary.
- We have learned that the sensor produce noisy data.
- We have seen a method to clean noisy data.
- We have discused the cruciality of selecting a window_size.
- We have seen a method for normalizing data.
NOTE: Now that I've done with post-processing recorded data, I can implement what I've learned into a pre-processing algorithm, that process data from sensor, before grading it.
The hole pre-processing raw data pipe-line:
5. Grading the drive
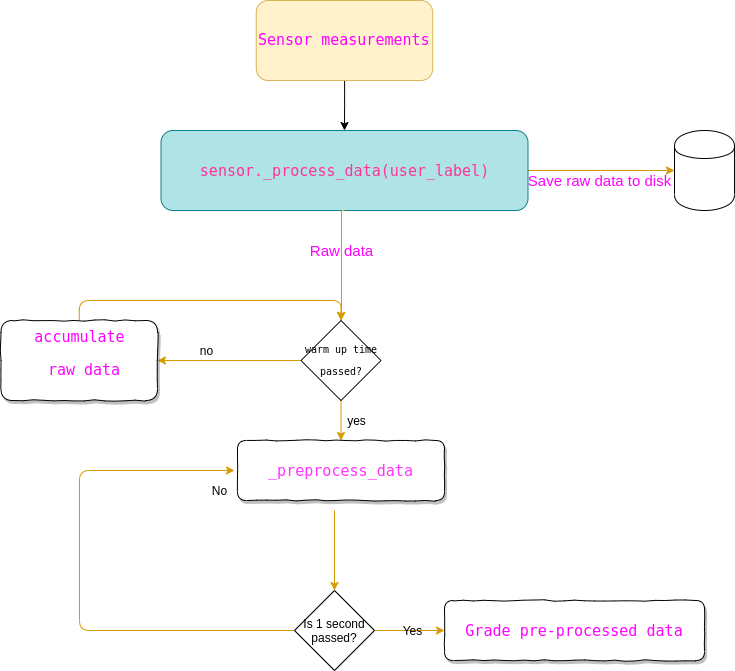
Within EDA, I have learned a lot about how data behaves, and what method will be best for data cleaning, and grade calculating. At this point, I had clean, normalized, 0-centered-distributed data. All I have left is to calculate driving score, but how?
Here's what I did:
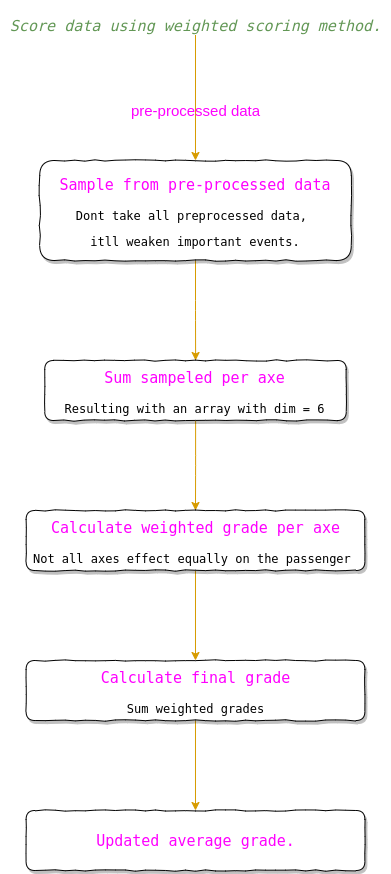
Step 1.
A reminder, the sensor measure accelerations. Given the data is smoothed, and normalized. Iv'e received a normalized chunk of data, lets call it $W(i)$, where $i$, is time, and $W$ is our sliding window, filled with pre-processed data, so for example:
W(i)[0] = [accx(i),accy(i),accz(i),gyrx(i),gyry(i),gyrz(i)]
W(i)[1] = [accx(i-1),accy(i-1),accz(i-1),gyrx(i-1),gyry(i-1),gyrz(i-1)]
At first, I calculated the grade by summing all $W$, but as it seems that doing so, result in focusing too much on sequential changes, rather then big, aggressive changes.
So in order to calculate grades with appropriate attention to acceleration changes, I've sampled $W$ using time gaps, between measures, this is how I did it:
for step in range(MAXNUMBEROFSCORES / scoring_sampling_step):
   grade[step] = (preprocessed_data_queue[scoring_sampling_step * step])
This time gap also needed to be adjusted:
- Too big, and the time between samples will forgive changes that accrue in a short burst.
- Too small, and occurrences that accrue for long time, wont be noticed, only the aggressive changes in small time section.
Step 2.
Summing all values, per axis:
raw_grade_per_axe = grade.sum(axis=0)
Resulting with:
raw_grade_per_axe = [sum_of_sampled_acc_x,sum_of_sampled_acc_y,sum_of_sampled_acc_z,sum_of_sampled_gyro_x,sum_of_sampled_gyro_y,sum_of_sampled_gyro_z]
Step 3.
Calculating weighted grades.
After making the grader work, It seems quite weird that changes in gyro_y that occur when, let say, driving on a slowing_bumps, will effect scoring as much as the aggressiveness of forward accelerating, that effect acc_x. So a weighted scoring is needed,hence, using the scores:
axis_weights = {
 "AX": 0.35,  # Driving direction
 "AY": 0.35,  # Cause for acceleration changes: Changing lanes aggressively
 "AZ": 0.1,  # Cause for acceleration changes: Path-holes
 "GX": 0.1,  # Cause for acceleration changes: One wheel Path-holes (or two wheels in the same side)
 "GY": 0.1,  # Cause for acceleration changes: Driving into driving-slower bumper
 "GZ": 0,  # Cause for acceleration changes: None?
}
The weighted score was calculated:
weighted_grade = [raw_grade_per_axe[i] * self._axis_weights[key] for i, key in
                          enumerate(self._axis_weights.keys())]
Step 4.
Calculating the actual score (FINALLY!!).
self._current_driving_score = res_array.sum() # If value is: 6, that's mean theres no acceleration changes at all.
And that's it :)
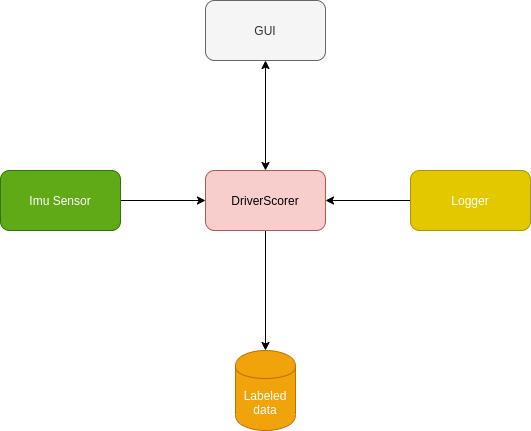
Project Modules
Though I'm an enthusiastic MAKER, I'm also a software engineer, and a project is nothing if not designed properly. Luckily, I have a GOF copy in my rear pocket :)
So, as for the sensor design:
As for DriverScorer design:
Wrapping up
All is left is to configure Ubuntu on the RPI so it'll boot right up into the DriverScorer gui, to do:
- I've created a
DriverScorerBoot.shas/home/pidirectory:
#!/bin/bash <- this line must be here.
# DriverScorerBoot.sh
cd ~/PycharmProjects/DrivingScorer/
source ./venv2/bin/activate
python driverScorer/gui.py
sudo poweroff # shut down the RPI, after user press "DONE" in the python GUI
I've added
program.desktopfile to~/.config/autostart(I needed to create the autostart directory)inside
program.desktopI inserted:
[Desktop Entry]
Type=Application
Name=DriverScorer
Exec=/home/pi/DriverScorerBoot.sh
X-GNOME-Autostart-enabled=true
And now, I plug in the power, and it boot right into the DriverScorer:
Project summary
As for a data science wannabe, in this project I've experienced my first EDA, and boy, I've learned a lot!
- I have understood how data behaves, using graphs, and analysis tools.
- I have fine tuned parameters in my grading algorithm, according to things I've discovered within EDA.
- I Used advanced methods for working with data.
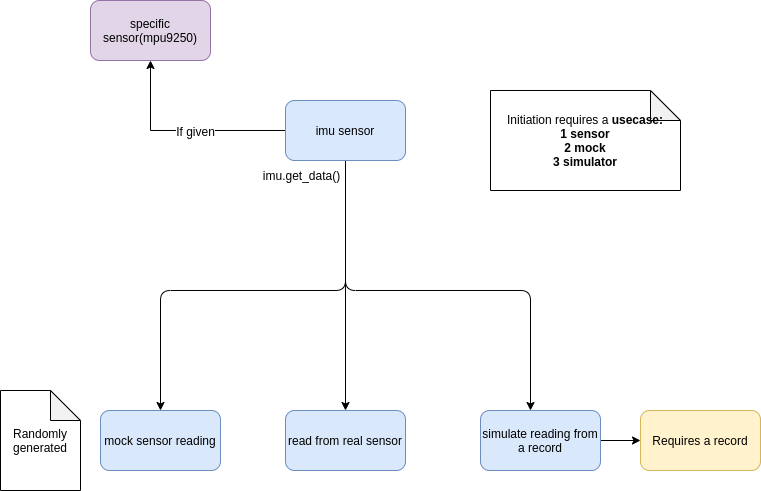
- At first I've worked with data using raw data streamed through the sensor, but this is quite problematic, sensing required real hardware for that, in my case RPI, so I tried to work via the vnc server, but its not ideal.
- Later on, I used sensor mocks, so I could develop the grading algorithm, but though this mock supplied values in same data structure as the sensor itself, the values didn't mock real life acceleration changes.
- Finally, I've used a simulation, that simulated the sensor, using records I've made earlier. This was definitely the best solution, using records I could record a behavior (or a scenario) that was controlled by me, It helped my during the grading algorithm development.
I have learned so much from this one, It kinda reminded me the reason I started doing these projects.
Cheers, Gal
Code n' stuff - my GitHub.